

Understanding Statistical Measures: A Guide to Statistics for Data Science (Part 1 of 3)


Introduction to the Series
Welcome to the first installment of our three-part series on statistics for data science. I'm excited to start this series alongside my colleague Vaishali, a brilliant Senior Data Scientist at USAA who brings valuable insights from her previous roles at Amazon and LendingTree.
In Part 1, we focus on fundamental statistical measures that form the backbone of data analysis. Parts 2 and 3 will build upon these concepts to explore more advanced statistical techniques and their applications.
In today’s data-driven world, tech companies rely heavily on statistical measures to derive insights from their data. These insights guide business decisions, user behavior analysis, and product optimization. Whether you're working with customer data, product performance, or engagement metrics, understanding basic statistical concepts is essential. This blog explores fundamental statistical measures and shows how they can be applied in the tech industry.
I. Measures of Central Tendency
Measures of central tendency help you identify the "center" of a dataset, providing insights into the typical value. These are crucial for understanding the general trend or behavior of a dataset.
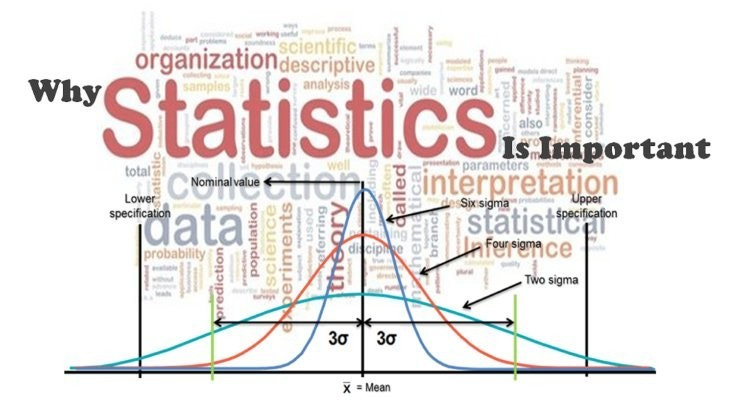
1. Mean (Average)
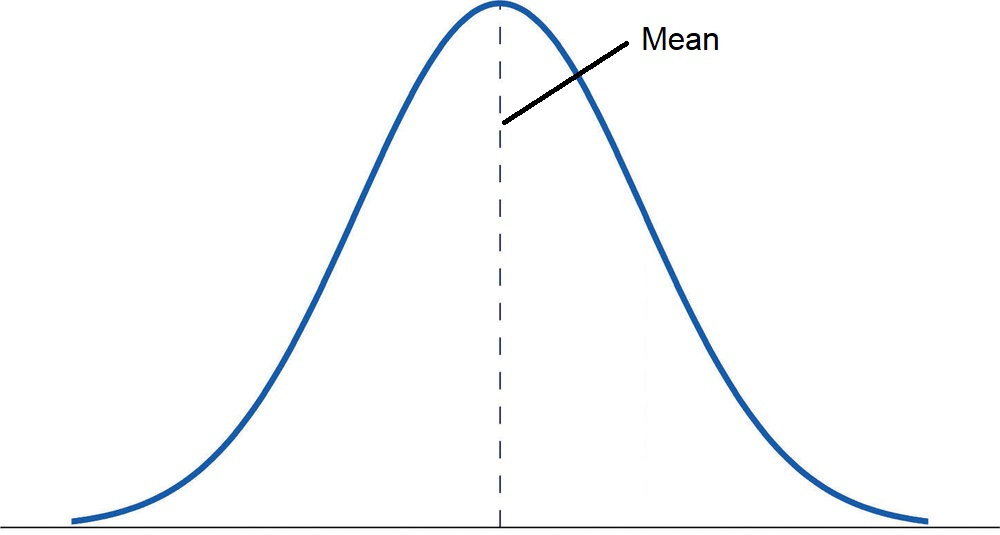
Image: Lunatic Laboratories
Definition: The sum of all values in a dataset divided by the total number of values.
Formula: μ = (Σx) / n
Real-World Explanation: The mean gives an overall sense of the average value, making it easier to summarize large datasets.
Example:
Netflix uses the mean to calculate the average viewing time per user per month. By analyzing data such as "average hours watched per user," Netflix can gauge user engagement across different regions, helping them optimize content recommendations and user experience.
2. Median
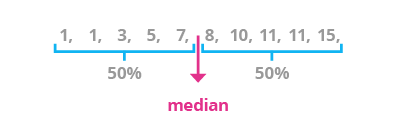
Image: Vertabelo Academy
Definition: The middle value in an ordered dataset, separating the higher half from the lower half.
Formula: For an ordered dataset, if n is odd, median = value at position (n+1)/2; if n is even, median = average of values at positions n/2 and (n/2)+1.
Real-World Explanation: The median is valuable when dealing with skewed data or outliers, as it provides the middle point.
Example:
Uber analyzes the median ride time for its drivers. By looking at the median rather than the mean, Uber can assess typical trip durations, even if certain rides are significantly longer due to traffic or route inefficiencies.
3. Mode
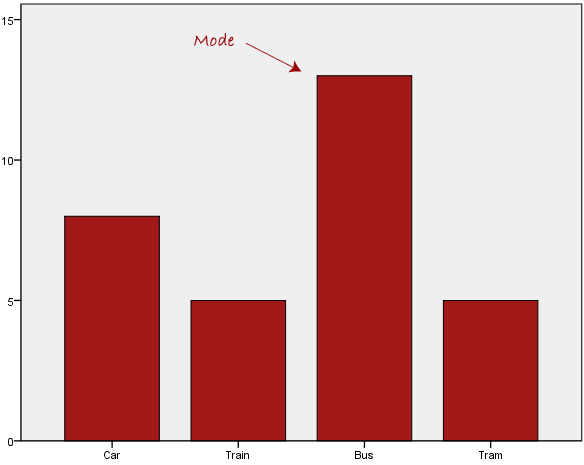
Image: Laerd Statistics
Definition: The value that appears most frequently in a dataset.
Formula: No standard formula; it's the value with the highest frequency.
Real-World Explanation: The mode helps identify the most common data points, which is useful for analyzing trends.
Example:
Amazon uses the mode to analyze product size preferences. For example, if the “large” size of a T-shirt is the most frequently purchased, Amazon can adjust inventory and marketing strategies to cater to this demand.
Comparing Mean, Median, and Mode
The relationship between these three measures provides valuable insights into your data distribution:
When mean = median = mode: Your data is perfectly symmetrical (normal distribution).
When mean > median: Your data is positively skewed, with a tail extending toward higher values. This often indicates outliers on the high end.
When mean < median: Your data is negatively skewed, with a tail extending toward lower values. This suggests outliers on the low end.
Understanding these relationships helps data scientists quickly assess data distribution patterns and identify potential outliers or subgroups that require further investigation.
II. Measures of Dispersion
Measures of dispersion indicate the spread or variability of data points in a dataset. Understanding dispersion is key to knowing how consistent or variable your data is.
4. Range
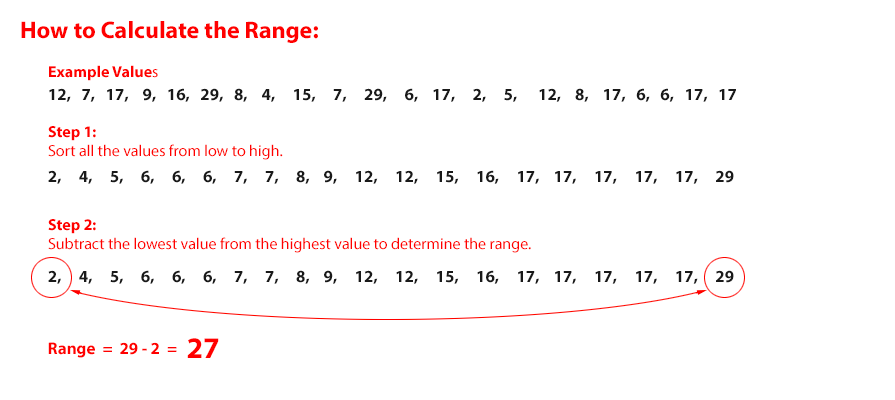
Image: Weatherstem
Definition: The difference between the highest and lowest values in a dataset.
Formula: Range = max(x) - min(x)
Real-World Explanation: The range helps identify how spread out the data is.
Example:
Google uses the range to analyze website load times. By comparing the fastest and slowest load times, Google can spot performance bottlenecks and work to improve the user experience.
5. Variance
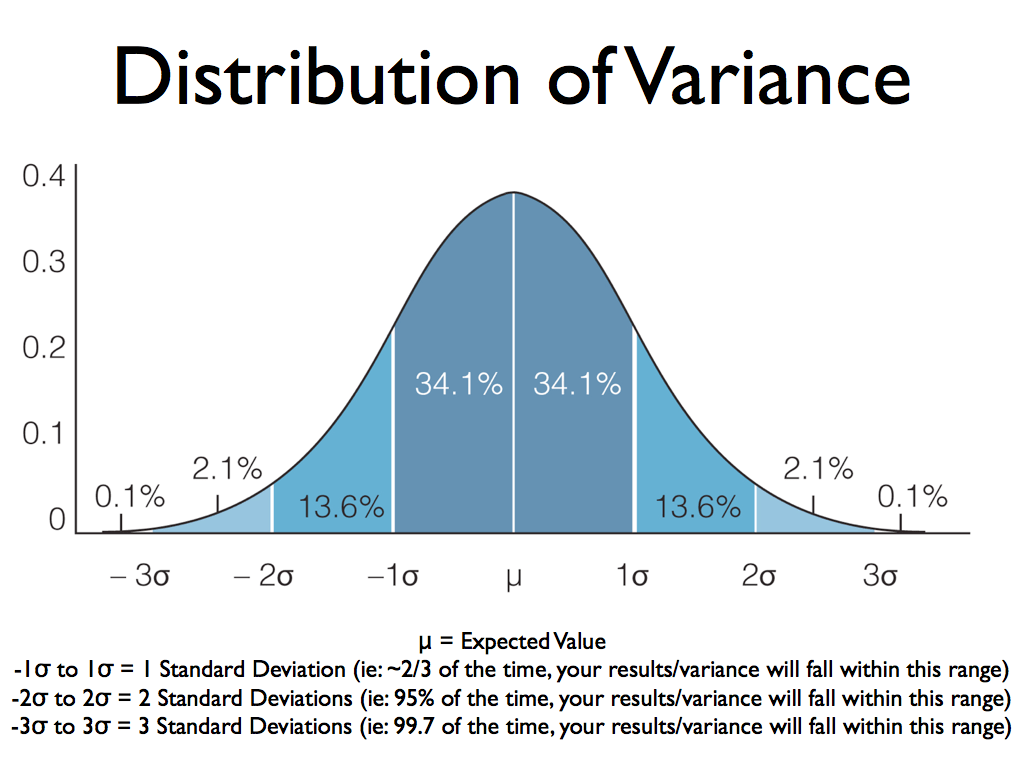
Image: Yassine EL KHAL
Definition: The average of the squared differences from the mean. It measures the extent to which data points differ from the mean.
Formula: σ² = Σ(x - μ)² / n
Real-World Explanation: Variance indicates how spread out the data is, with larger values signaling more variability.
Example:
Facebook uses variance to understand the engagement rate of different posts. By analyzing the variance in likes, comments, and shares, Facebook can optimize content delivery to users based on engagement patterns.
6. Standard Deviation
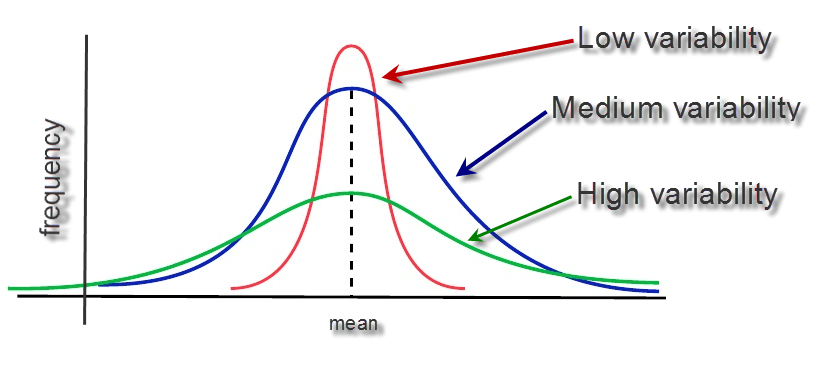
Image: Medium
Definition: A measure that quantifies the amount of variation or dispersion in a dataset. It's the square root of variance.
Formula: σ = √(σ²) = √(Σ(x - μ)² / n)
Real-World Explanation: Standard deviation helps in understanding how much the values deviate from the mean. A smaller standard deviation indicates more consistency.
Example:
Twitter uses standard deviation to measure the engagement variability across tweets. A high standard deviation indicates that some tweets are highly popular, while others receive minimal engagement, guiding Twitter’s content strategies.
III. Measures of Relationship
Measures of relationship help to understand how different variables in a dataset relate to one another. These metrics are crucial when analyzing how changes in one variable affect another.
7. Correlation
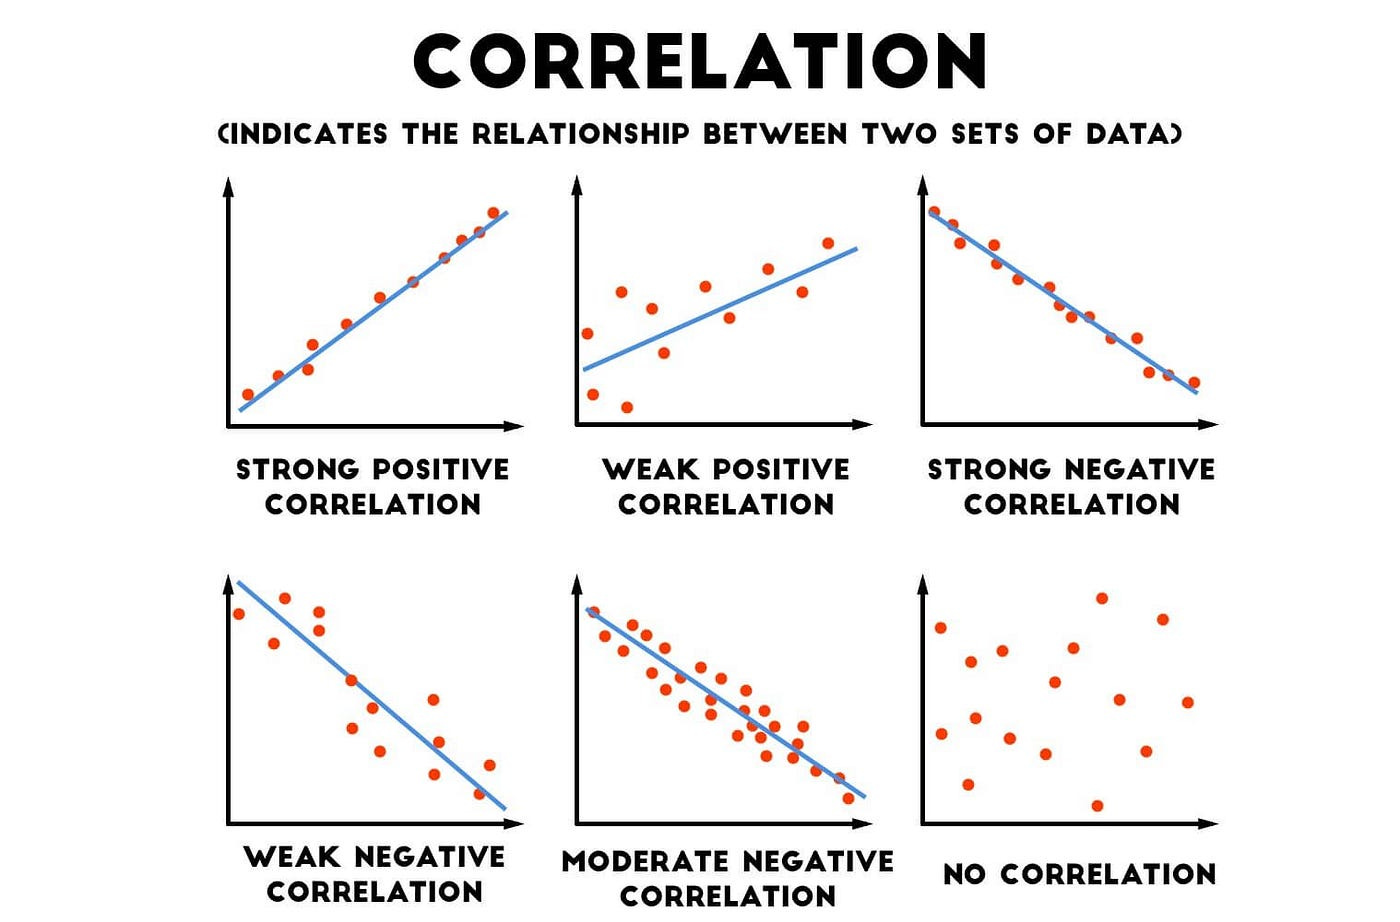
Image: GozdeGozutok
Definition: A statistical measure that describes the extent to which two variables are related. Correlation can be positive, negative, or zero.
Formula: r = Σ((x - μx)(y - μy)) / (n·σx·σy)
Real-World Explanation: Correlation helps you understand whether an increase in one variable will result in an increase or decrease in another.
Example:
Spotify uses correlation to analyze the relationship between the time of day and user engagement. By understanding whether users listen more in the morning or evening, Spotify can tailor playlist recommendations to the times when users are most active.
8. Covariance
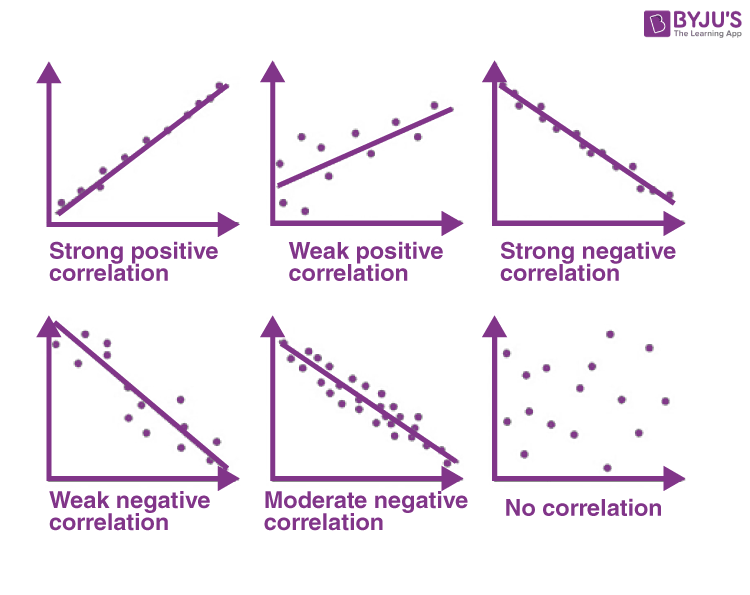
Image: BYJU’S
Definition: A measure of how two variables change together. It indicates whether increases in one variable correspond to increases or decreases in another.
Formula: cov(x,y) = Σ((x - μx)(y - μy)) / n
Real-World Explanation: While similar to correlation, covariance isn't normalized, so the magnitude of the values can vary depending on the units of measurement.
Example:
Airbnb uses covariance to understand how changes in pricing correlate with booking rates. For instance, they can examine how increases in nightly rates affect the number of bookings in a particular location during peak seasons.
9. Skewness
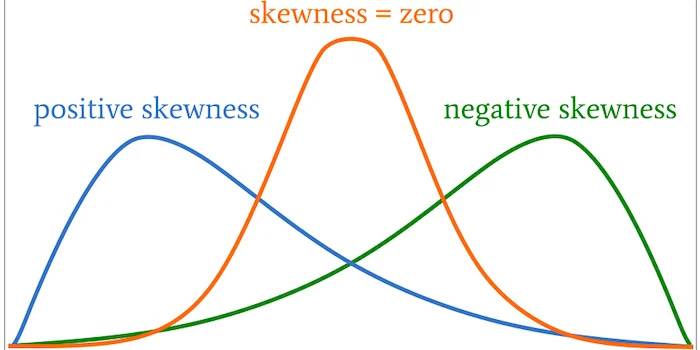
Image: Walid Soula
Definition: A measure of the asymmetry or deviation from symmetry in a dataset. A skewed distribution means that one tail is longer than the other.
Formula: Skewness = Σ((x - μ)³) / (n·σ³)
Real-World Explanation: Skewness helps identify whether the data is more concentrated on one side of the mean.
Example:
Amazon uses skewness to analyze the distribution of product prices. If the distribution is positively skewed, it indicates that most products are priced lower, with a few products being significantly more expensive. This can help Amazon adjust its pricing strategies.
Key Takeaways
Central Tendency: The mean, median, and mode help summarize a dataset, providing a quick understanding of the "typical" value in different contexts.
Dispersion: Measures like range, variance, and standard deviation help gauge the spread of data, indicating how consistent or variable the values are.
Relationship: Understanding correlation and covariance helps identify relationships between variables, which can guide decision-making in areas like pricing, engagement, and user behavior.
Shape of the Data: Skewness and kurtosis are useful for identifying the symmetry and the presence of outliers in your data, which can impact how you analyze and interpret results.
By mastering these fundamental statistical concepts, you can better analyze data, make informed decisions, and optimize strategies, whether you're in tech, marketing, finance, or any other data-driven field.
Best of luck for everything!
- Sai Bysani, a fellow Hustler!
Keep grinding, keep growing,
The Data Hustle.
 | A guest post by
|
This is great!! Looking forward to parts 2 and 3!