

Going Deeper into Statistics: Practical Measures for Real-World Analysis (Part 2 of 3)


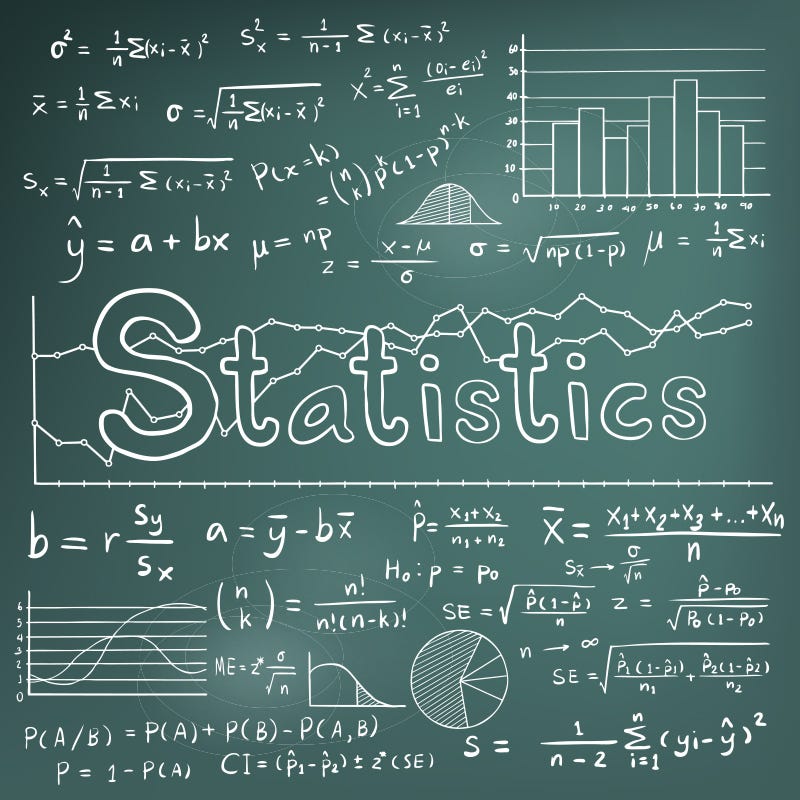
Welcome to the second installment of our three-part series on statistics for data science. I'm excited to continue this series alongside my colleague Vaishali, a brilliant Senior Data Scientist at USAA who brings valuable insights from her previous roles at Amazon and LendingTree.
In Part 1, we focused on fundamental statistical measures that form the backbone of data analysis. Now, we’ll build on that foundation with more powerful concepts that help companies make smarter, data-driven decisions. Whether you’re analyzing user behavior, product performance, or operational efficiency, these tools are essential for deeper insights.
I. Measures of Position
Measures of position help us understand where a particular value falls within a dataset. They are especially useful when analyzing customer behaviors, setting goals, or benchmarking performance.
1. Percentiles and Quartiles
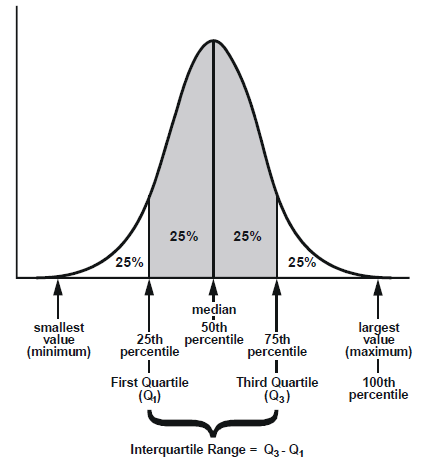
Image: StackExchange
Definition:
Percentiles divide data into 100 equal parts. Quartiles divide it into four parts (Q1 at 25%, Q2 at 50%, and Q3 at 75%).
Simple Explanation:
They help identify thresholds - where most data points lie and where the extremes start.
Real-World Example:
DoorDash tracks delivery times using percentiles. If the 90th percentile delivery time is 45 minutes, it means 90% of deliveries are faster and only 10% take longer. This helps them spot operational issues and improve service.
2. Z-Scores
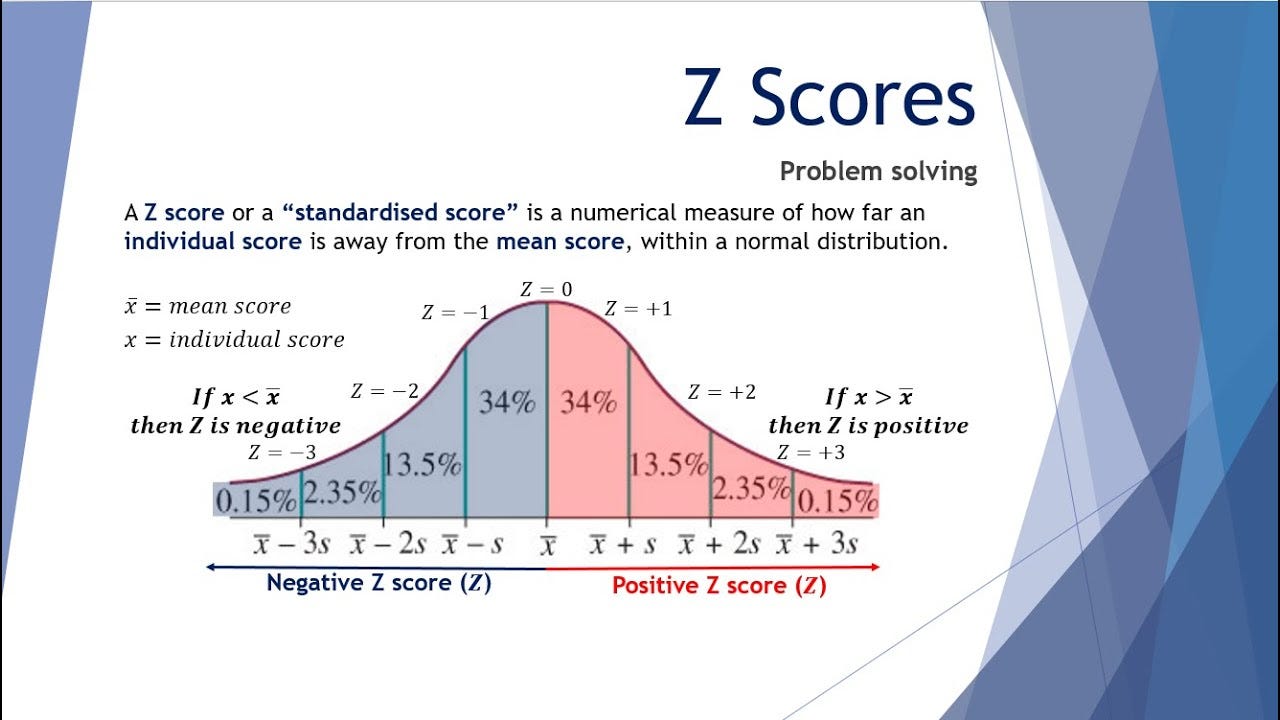
Image: Juddy Productions
Definition:
A Z-score tells you how far (in standard deviations) a data point is from the mean.
Simple Explanation:
It helps find unusual data points that are much higher or lower than the average.
Real-World Example:
Airbnb uses Z-scores to identify listings that are priced far above or below the city average. Properties with extremely high or low Z-scores might get flagged for review to ensure fair pricing.
II. Confidence and Significance
When making decisions, it’s important to understand how certain you are about your results. Confidence intervals and hypothesis testing help with this.
3. Confidence Intervals
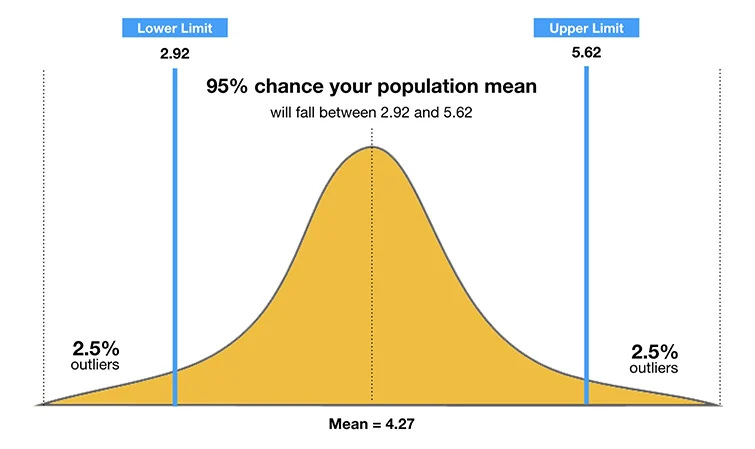
Image: Simply Psychology
Definition:
A range of values within which we believe the true value lies, with a certain level of confidence (usually 95%).
Simple Explanation:
Instead of guessing one number, you get a range you can be pretty sure the real answer falls into.
Real-World Example:
LinkedIn may estimate that average daily user time is between 18 and 22 minutes with 95% confidence. This range helps them set realistic engagement targets without overpromising.
4. Hypothesis Testing
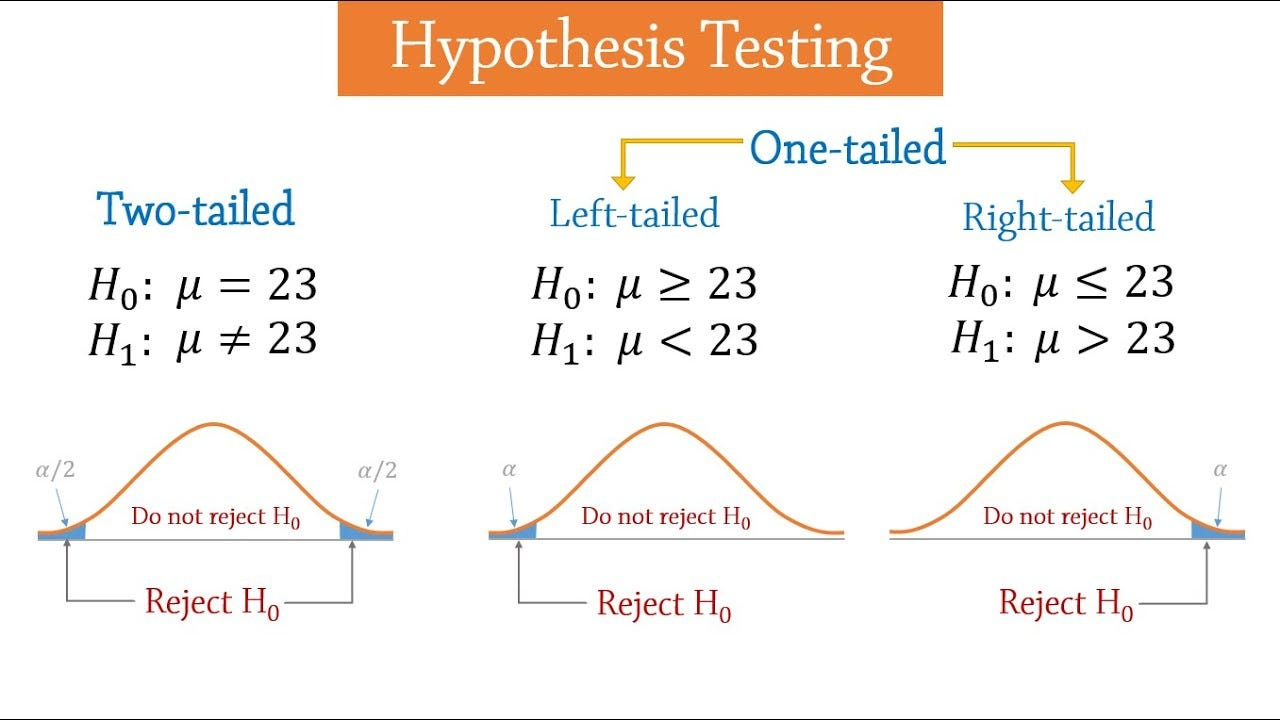
Image: Amanatullah
Definition:
A formal process for testing an idea (hypothesis) about the population based on sample data.
Simple Explanation:
It’s how companies check if a change (like a new app feature) actually worked or if the results were random.
Real-World Example:
Netflix runs A/B tests to see if a new homepage design gets more clicks. Hypothesis testing helps decide if the new design is truly better or if the difference could just be random.
5. P-Values
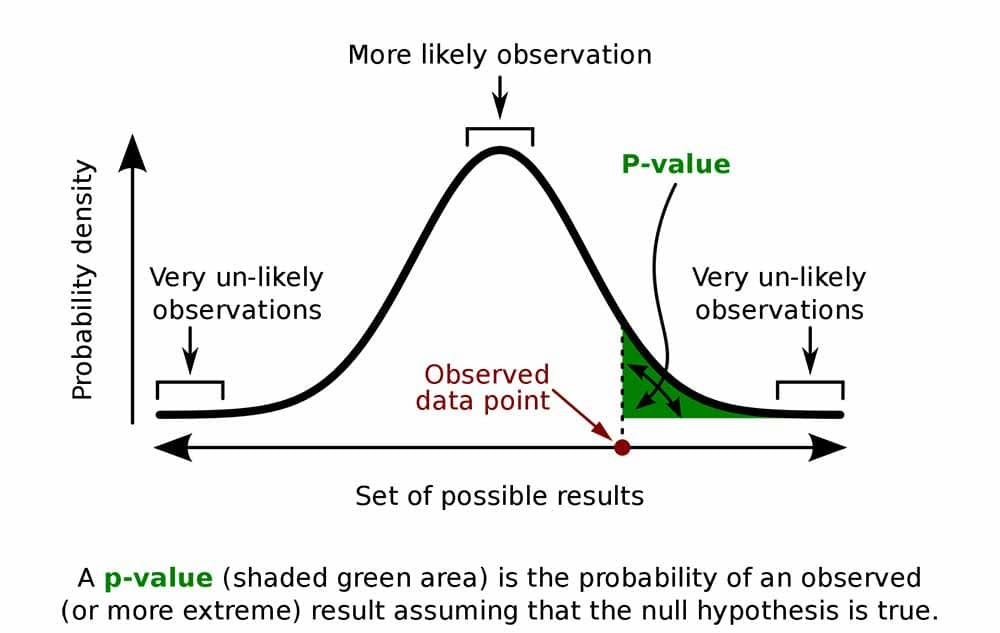
Image: Simply Psychology
Definition:
The probability of observing the data (or something more extreme) if the null hypothesis is true.
Simple Explanation: A p-value tells you how likely it is that your results happened just by random chance. A small p-value (usually less than 0.05) means it’s very unlikely the results are random - so your change probably made a real difference.
Real-World Example:
Facebook evaluates the success of new features using p-values. If a feature increases user engagement with a p-value of 0.01, they conclude the improvement is statistically significant and roll it out to more users.
III. Descriptive vs Inferential Statistics
Understanding the difference between describing what happened and predicting what might happen is key for business strategy.
6. Descriptive vs Inferential Statistics
Definition:
Descriptive statistics summarize the data you have (like averages or percentages).
Inferential statistics use the data to make predictions or generalizations about a larger group.
Simple Explanation:
Descriptive = "What happened?" Inferential = "What might happen?"
Real-World Example:
Spotify uses descriptive statistics to report last quarter’s most played artists and inferential statistics to predict what genres will trend next quarter.
Key Takeaways
Percentiles and Z-scores help you benchmark data and find outliers.
Confidence intervals give you a range you can trust when estimating.
Hypothesis testing and p-values are crucial for making confident, data-driven decisions.
Descriptive statistics summarize past data, while inferential statistics help predict future trends.
Mastering these deeper concepts gives you the tools not just to analyze data, but to test ideas, manage uncertainty, and make smarter business decisions.
In Part 3, we dive into advanced techniques like regression, statistical power, and time series analysis. These concepts help businesses move beyond observation to prediction and optimization. By modeling relationships, managing uncertainty, and forecasting trends, companies make smarter, data-driven decisions.
Best of luck for everything!
- Sai Bysani, a fellow Hustler!
Keep grinding, keep growing,
The Data Hustle.
 | A guest post by
|