

Building an End-to-End Data Analytics Portfolio Project

WHY PORTFOLIO PROJECTS MATTER
In today's competitive job market, having strong portfolio projects is no longer optional for data analytics professionals. A well-executed end-to-end analytics project demonstrates your technical capabilities, your business acumen, and your ability to communicate insights effectively, all crucial factors employers evaluate when hiring.
For this newsletter and to make it easier for you to understand, we'll walk through an end-to-end retail sales performance analysis that demonstrates business impact while showcasing core data analytics skills.
THE BUSINESS PROBLEM
Regional retail chain "HomeGoods Plus" wants to understand sales performance across their 85 stores to:
Identify underperforming and overperforming stores
Understand key factors driving performance differences
Develop data-driven recommendations to improve overall sales
This scenario is ideal for a portfolio project because it:
Addresses a common business challenge with a measurable impact
Requires multiple analytical techniques that don't require advanced statistics or ML
Demonstrates both technical skills and business acumen
Creates compelling visualization opportunities
PROJECT ROADMAP: 7 CRITICAL PHASES
1. PROBLEM FRAMING & BUSINESS UNDERSTANDING
Key Activities:

Image: Hook
Define the business questions precisely (What constitutes "performance" for this retailer?)
Identify stakeholders and their needs (Regional managers need actionable store-level insights)
Establish success metrics (Identify opportunities to increase revenue by 8% in underperforming stores)
Document assumptions and constraints
Portfolio Demonstration: Create a project charter or business requirements document that shows you understand the business context. This demonstrates you're not just technically skilled but business-minded.
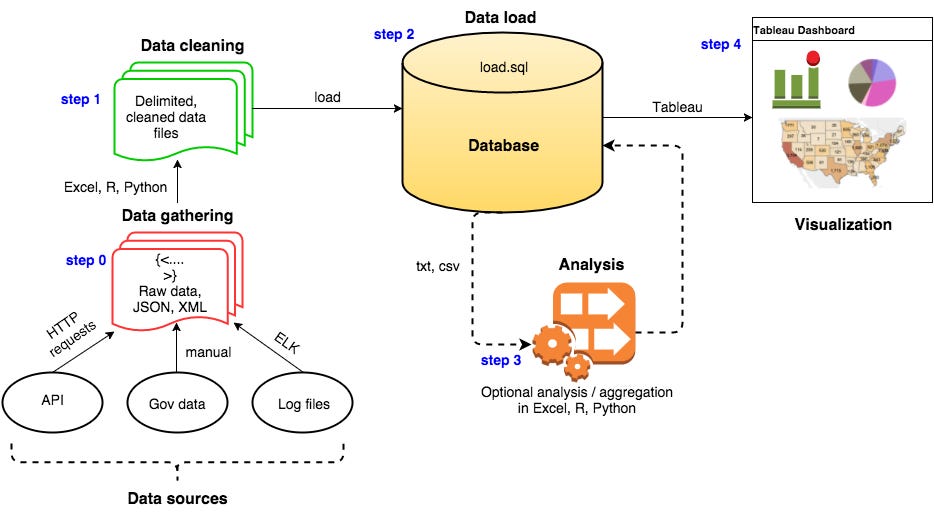
2. DATA COLLECTION & UNDERSTANDING

Image: GeeksforGeeks
Key Activities:
Identify necessary data sources (store sales, inventory, staffing, demographics, etc.)
Understand data structure and relationships
Document data limitations and gaps
Develop a data dictionary
Set up automated data collection methods (APIs, web scraping). This will set you apart from the competition!
Portfolio Demonstration: Create a data mapping document that shows how you'll connect different data sources. This demonstrates your ability to work with diverse business data.
3. DATA PREPARATION & TRANSFORMATION
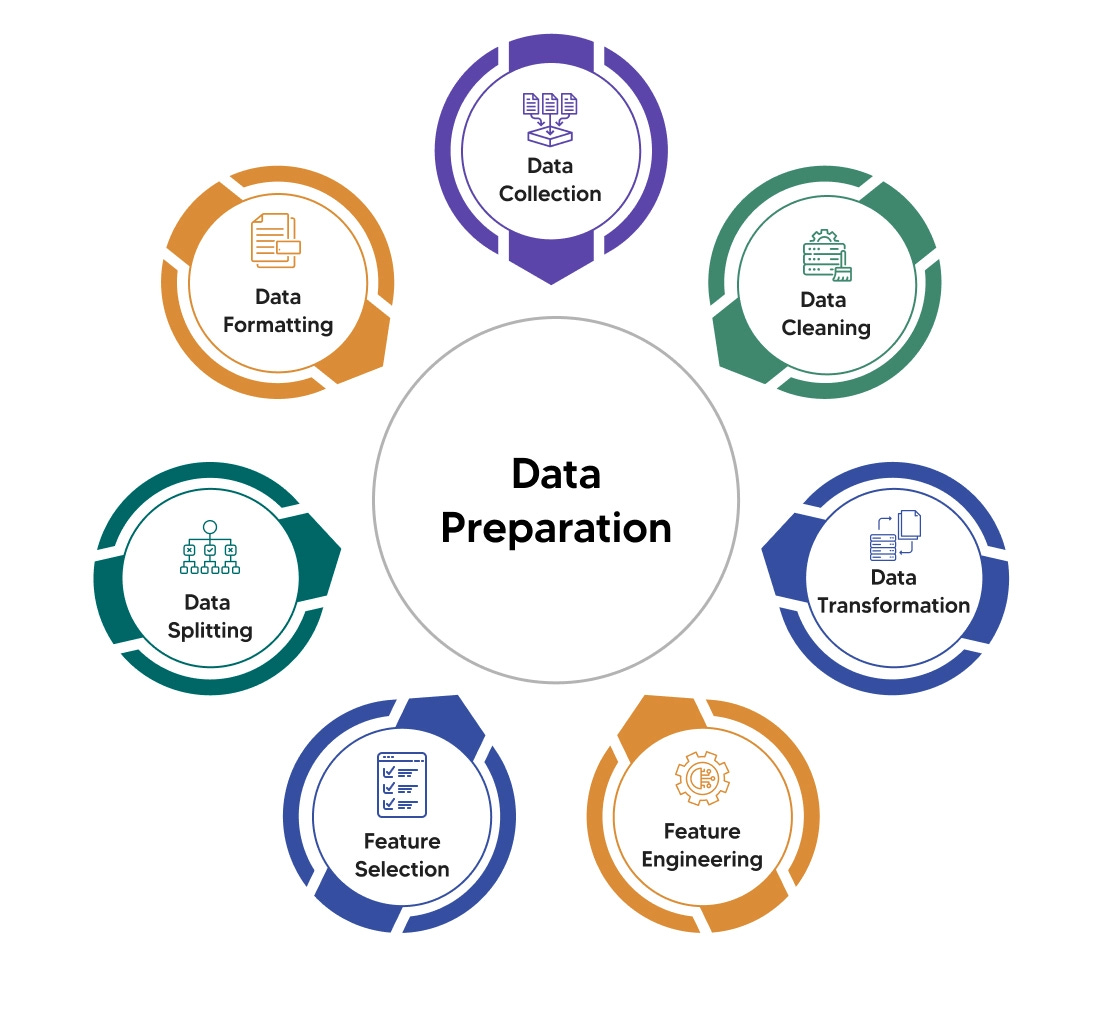
Image: Kellton
Key Activities:
Clean and standardize raw data
Handle missing values and outliers
Create derived metrics and KPIs
Aggregate data at appropriate levels
Portfolio Demonstration: Document your data transformation process with clear reasoning for each decision. This shows your technical skills and business understanding.
4. EXPLORATORY ANALYSIS & PATTERN DISCOVERY

Image: GeeksforGeeks
Key Activities:
Identify trends and patterns across stores
Discover correlations between performance and other factors
Segment stores by performance characteristics
Test initial hypotheses about performance drivers
Portfolio Demonstration: Create an exploratory analysis with clear visualizations that tell a story. This demonstrates your ability to uncover insights from data.
5. DEEP DIVE ANALYSIS & INSIGHT GENERATION
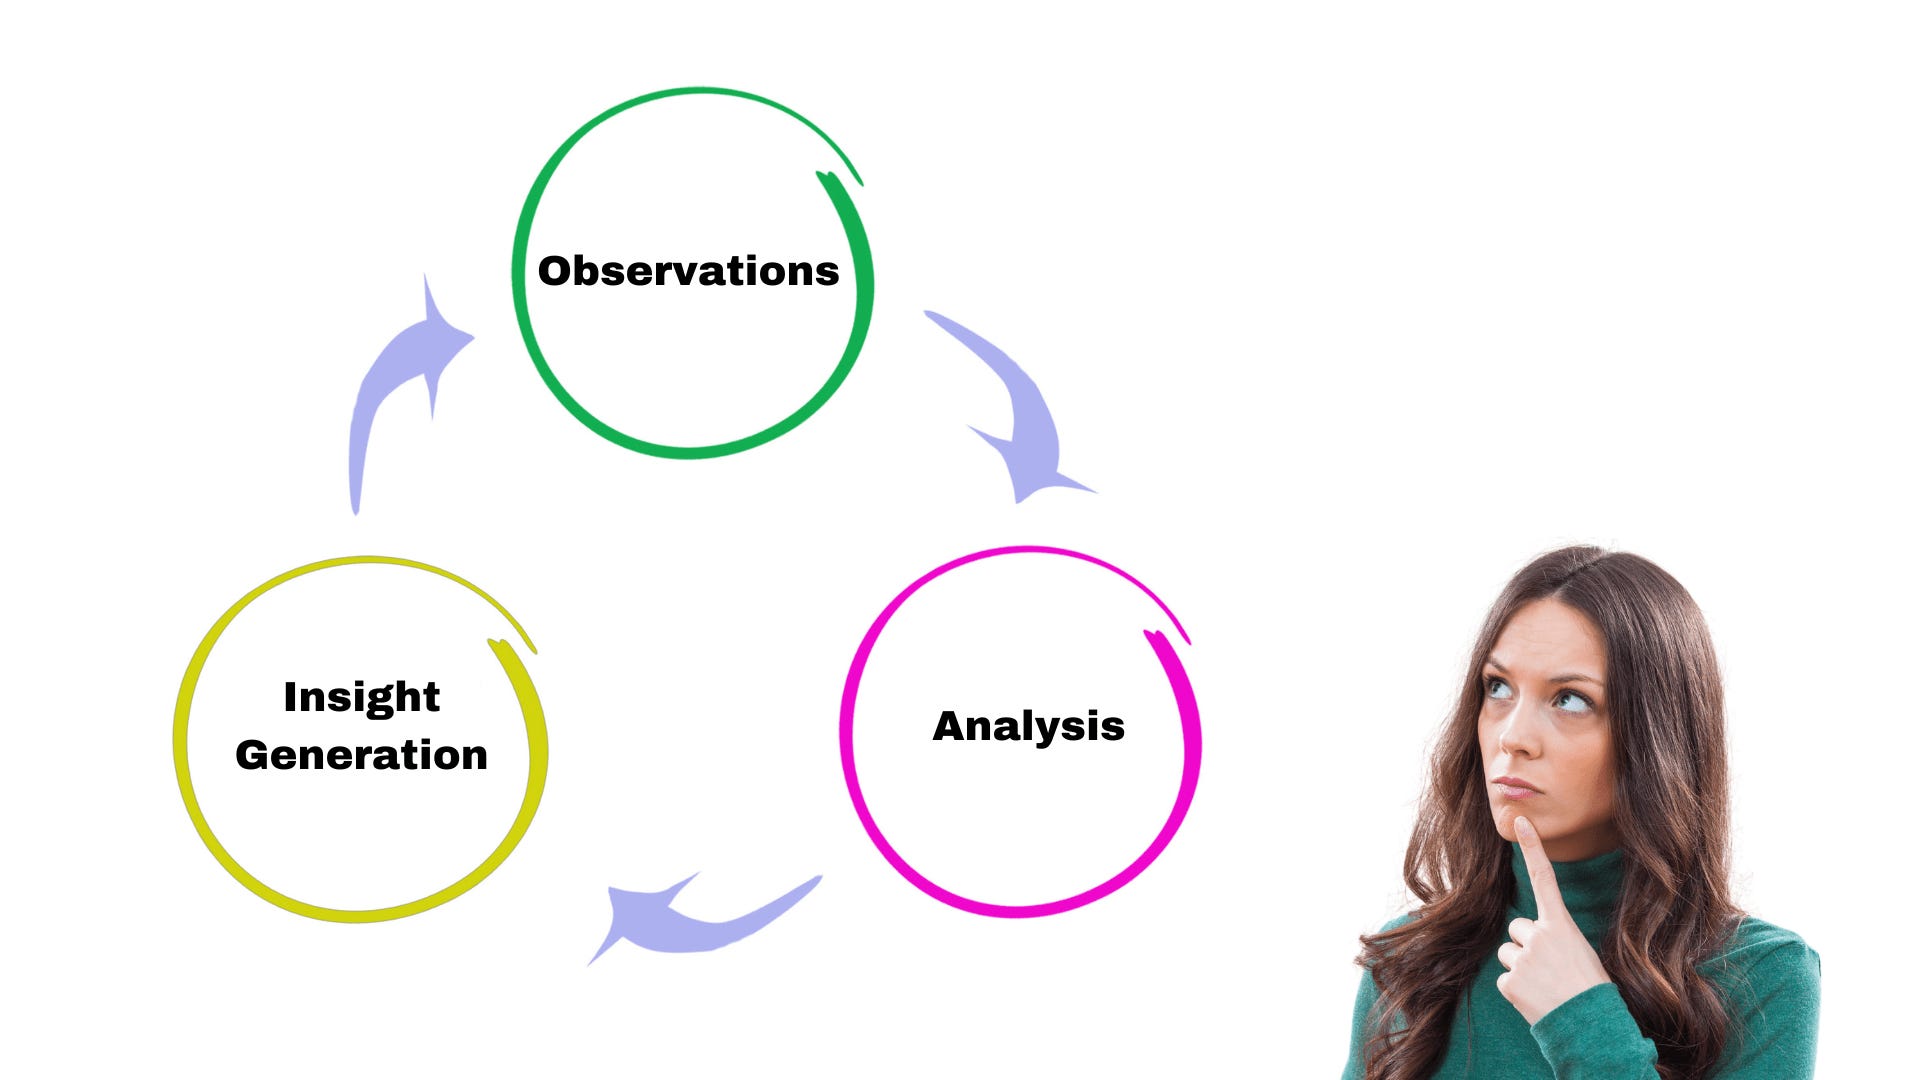
Image: PharmaState Academy
Key Activities:
Perform detailed analysis on key patterns
Quantify the impact of different factors
Develop store-specific insights
Identify actionable improvement levers
Portfolio Demonstration: Translate patterns into clear business insights with specific recommendations. This shows you can bridge the gap between analysis and action.
6. DASHBOARD CREATION & VISUALIZATION
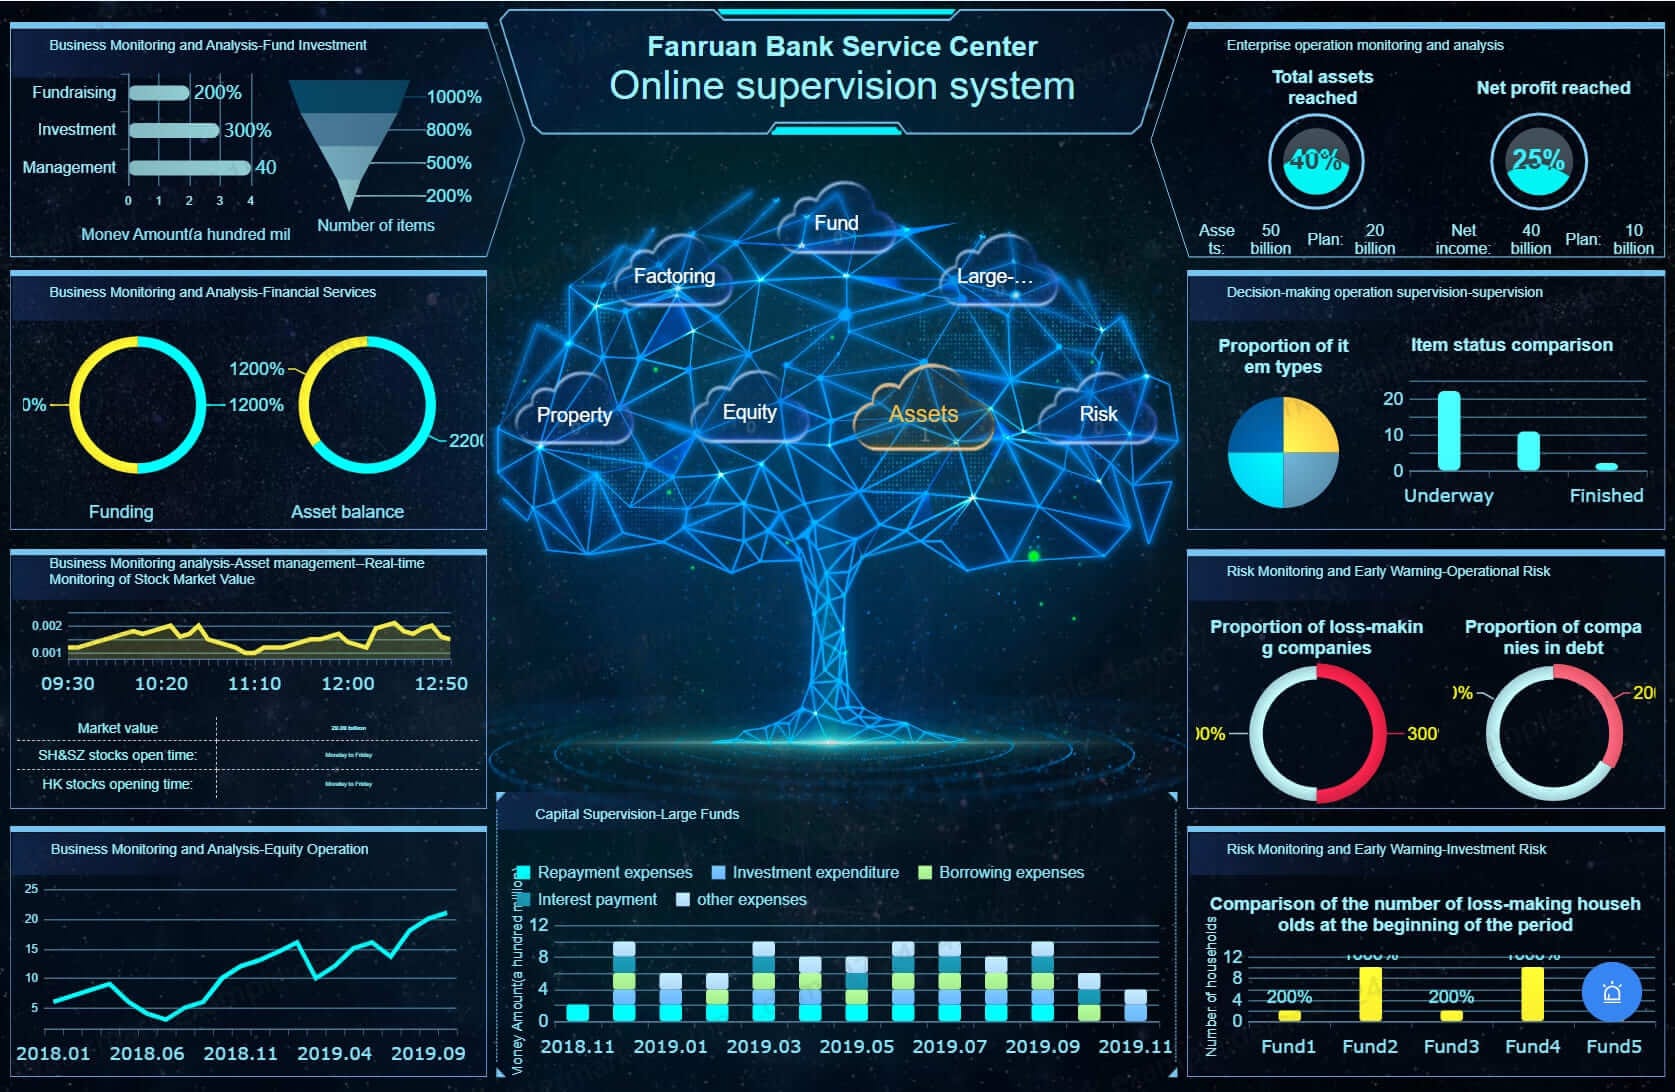
Image: FineReport
Key Activities:
Design an interactive dashboard with key metrics
Create visualizations for different stakeholders
Develop store comparison tools
Build performance-tracking system
Portfolio Demonstration: Develop a dashboard that clearly communicates your insights in a visually compelling way. This demonstrates your ability to make data accessible to business users.
7. REPORTING & RECOMMENDATIONS PRESENTATION

Image: Zuci Systems
Key Activities:
Create an executive summary with key findings
Develop detailed recommendations
Design implementation roadmap
Create a monitoring plan to track improvements
Portfolio Demonstration: Include a presentation and implementation plan showing how your insights translate to action. This demonstrates your understanding of the full analytics lifecycle.
PORTFOLIO PRESENTATION BEST PRACTICES
To maximize the impact of your project:
Tell a complete story: Frame the business problem, your approach, findings, and impact clearly
Showcase your SQL skills: Include actual queries used for data extraction and transformation
Visualize effectively: Create compelling dashboards that business people can understand
Document your process: Include your reasoning, challenges faced, and how you overcame them
Quantify impact: Express outcomes in business terms (potential revenue increase, efficiency gained)
Demonstrate versatility: Show multiple technical and business skills within a single coherent project
Build a data pipeline: Create an automated workflow that refreshes analyses and reports
TECHNICAL SKILLS DEMONSTRATED
A strong data analytics portfolio project should showcase these key technical skills:
Data manipulation: SQL queries, Excel/Google Sheets functions, data transformations
Data cleaning: Handling missing values, standardizing formats, fixing inconsistencies
Exploratory analysis: Discovering patterns, outliers, and relationships
Dashboard creation: Tableau, Power BI, Looker, or Google Data Studio
Business metrics: KPI development, performance measurement
Data visualization: Charts, graphs, and visual storytelling
Presentation skills: Clear communication of insights to different audiences
Data pipeline development: Automated data collection, transformation, and reporting
API integration: Connecting to external data sources programmatically
Web scraping: Ethically collecting publicly available data
RECOMMENDED TOOLS & RESOURCES
Project Infrastructure:
SQL for data extraction and manipulation
Excel/Google Sheets for initial analysis
Tableau/Power BI for dashboard creation
GitHub for version control and project hosting
Apache Airflow for data pipeline orchestration
Python (Requests/BeautifulSoup) for API integration and web scraping
Learning Resources:
Here are a few guided projects for you to get started.
Yelp Business reviews analysis- S3, Python, Snowflake, SQL
𝐋𝐢𝐧𝐤:End-to-end data analytics ETL project - SQL and Python
Link:
Build an ETL Pipeline with Python
Link:
Playlists:
Check out this playlist for amazing guided projects by codebasics
Link: https://www.youtube.com/playlist?list=PLeo1K3hjS3utcb9nKtanhcn8jd2E0Hp9b
Another amazing playlist by Alex the Analyst
Link: https://www.youtube.com/playlist?list=PLUaB-1hjhk8H48Pj32z4GZgGWyylqv85f
Remember, getting started with guided projects is completely fine, but don't rely on them completely. Try not to put these on your resume!
💡 𝐏𝐫𝐨 𝐭𝐢𝐩: Use these to learn, but don’t just copy them for your resume. Build your own unique projects, that’s where real learning happens!
GOING THE EXTRA MILE: BUILDING DATA PIPELINES
What truly sets apart exceptional data analytics portfolio projects is the implementation of automated data pipelines. A data pipeline demonstrates your ability to think beyond one-time analysis and shows potential employers that you understand how data solutions operate in production environments.
Key Components of a Data Analytics Pipeline:
Automated Data Collection: Schedule regular API calls to collect fresh competitor pricing data, economic indicators, and weather information
Data Processing Workflow: Create a sequence of transformation steps that clean and standardize incoming data
Incremental Analysis Updates: Design your analysis to efficiently update with new data rather than reprocessing everything
Scheduled Dashboard Refreshes: Ensure visualizations automatically reflect the latest insights
Alert System: Implement notifications for significant changes in key metrics
Remember, not all of these need to be implemented. Find the gaps and fill them with automation.
Why Pipelines Matter:
They demonstrate technical maturity and understanding of real-world challenges
They show you can build sustainable solutions, not just one-off analyses
They highlight your ability to automate repetitive tasks, allowing focus on higher-value work
They signal to employers that you understand how analytics functions in production
CONCLUSION
An end-to-end data analytics project demonstrates your ability to solve real business problems using data. By following this framework and incorporating advanced elements like API integration and automated pipelines, you'll create a portfolio piece that truly stands out from the competition.
Best of luck for everything!
- Sai Bysani, a fellow Hustler!
Keep grinding, keep growing,
The Data Hustle.
incredibly cool project!
Helpful. Easy Understanding.